Written by Lucas Kohorst.
After creating the Free Wtr bot using Tweepy and Python and this code, I wanted a way to see how Twitter users were perceiving the bot and what their sentiment was. So I created a simple data analysis program that takes a given number of tweets, analyzes them, and displays the data in a scatter plot.
Image credit.
Setup
I had to install a few packages to create this: Tweepy, Tkinter, Textblob and matplotlib. You can install each of these with the pip package manager. For example:
pip install tweepy
or you can clone into the Github repository like this.
git clone https://github.com/sloria/textblob
cd textblob
python setup.py install
Next you will need to create a new Python file and import the following packages.
import tweepy #The Twitter API
from Tkinter import * #For the GUI
from time import sleep
from datetime import datetime
from textblob import TextBlob #For Sentiment Analysis
import matplotlib.pyplot as plt #For Graphing the Data
Twitter Credentials
Now we need to link a Twitter account to our script. If you don’t have one already, create one.
Go to apps.twitter.com and sign in with your account. Create a Twitter application and generate a Consumer Key, Consumer Secret, Access Token, and Access Token Secret.
Under your import statements, store your credentials in variables and then use the second block of code to authenticate your account with Tweepy.
consumer_key = 'consumer key'
consumer_secret = 'consumer secrets'
access_token = 'access token'
access_token_secret = 'access token secret'
auth = tweepy.OAuthHandler(consumer_key, consumer_secret)
auth.set_access_token(access_token, access_token_secret)
api = tweepy.API(auth)
If you want to test to see if your account is properly authenticated, you could simply print your username to the console.
user = api.me()
print (user.name)
Creating the GUI
For the interface, we will use two labels: one for the search and the other for the sample size or number of tweets to be analyzed. We will also need a submit button so that when clicked, we can call our getData function.
root = Tk()
label1 = Label(root, text="Search")
E1 = Entry(root, bd =5)
label2 = Label(root, text="Sample Size")
E2 = Entry(root, bd =5)
submit = Button(root, text ="Submit", command = getData)
So that the computer knows to keep the GUI on the screen, we need to pack our labels and then loop the root display.
label1.pack()
E1.pack()
label2.pack()
E2.pack()
submit.pack(side =BOTTOM)
root.mainloop()
Simply running this code, you should see a window that looks something like this:

However when text is input into the labels or the submit button is clicked, nothing happens. We have to collect the data.
Analyzing Tweets
First, we have to get the text input into the labels.
def getE1():
    return E1.get()
def getE2():
    return E2.get()
Now we are ready to code the getData function. From now on, all code is in this function:
def getData():
    #Code
We need to use the GetE1() and GetE2() functions. These store our search and sample size in variables that we can loop through.
getE1()
    keyword = getE1()
getE2()
    numberOfTweets = getE2()
    numberOfTweets = int(numberOfTweets)
In order to store our data, we can use lists. One list is for the polarity (or sentiment) of the tweets, and another for the number of the tweet (so that we can graph the data).
    polarity_list = []
    numbers_list = []
    number = 1
The number of tweets needs to be declared as 1 because the default value is 0.
We can now begin to iterate through the tweets and analyze them. Using TextBlob, we can find the sentiment of each tweet and store it to a variable polarity . We can then append this variable to our polarity_list along with appending the number to our number_list.
analysis = TextBlob(tweet.text)
analysis = analysis.sentiment
polarity = analysis.polarity            polarity_list.append(polarity)            numbers_list.append(number)
number = number + 1
We take this code and, using a for loop and try statement, we iterate it over the number of tweets for the search keyword.
for tweet in tweepy.Cursor(api.search, keyword, lang="en").items(numberOfTweets):
        try:
            analysis = TextBlob(tweet.text)
            analysis = analysis.sentiment
            polarity = analysis.polarity
            polarity_list.append(polarity)
            numbers_list.append(number)
            number = number + 1
except tweepy.TweepError as e:
            print(e.reason)
except StopIteration:
            break
Graphing Scatter Plot
In order to graph our scatter plot with matplotlib, we first have to define the axis
axes = plt.gca()
axes.set_ylim([-1, 2])
and then plot our lists of data.
plt.scatter(numbers_list, polarity_list)
Key information is shown in a box. In order to show the overall sentiment of the tweets we gathered, we calculate the average across all collected Tweets. Also, since we are displaying the sentiment at a specific time, we want to display the date and time.
averagePolarity = (sum(polarity_list))/(len(polarity_list))
averagePolarity = "{0:.0f}%".format(averagePolarity * 100)
time  = datetime.now().strftime("At: %H:%M\nOn: %m-%d-%y")
plt.text(0, 1.25, "Average Sentiment: " + str(averagePolarity) + "\n" + time, fontsize=12, bbox = dict(facecolor='none', edgecolor='black', boxstyle='square, pad = 1'))

For the title, we can use this
plt.title("Sentiment of " + keyword + " on Twitter") plt.xlabel("Number of Tweets")
plt.ylabel("Sentiment")
and finally use plot.show() to display the graph.

Example
Testing this for my Free Wtr bot, the sentiment was sky high!
Sample Size of 250 Tweets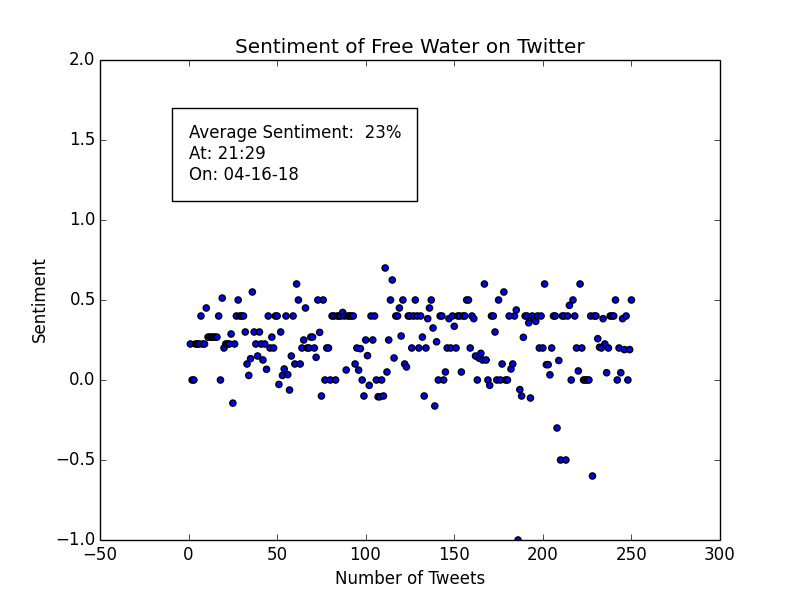
as for Donald Trump, I cannot say the same:

Here is the full source code on Github.
Basic data analysis on Twitter with Python was originally published in freeCodeCamp on Medium.