Can't pass tests on tooltip - D3 Bar Chart

Hi guys,

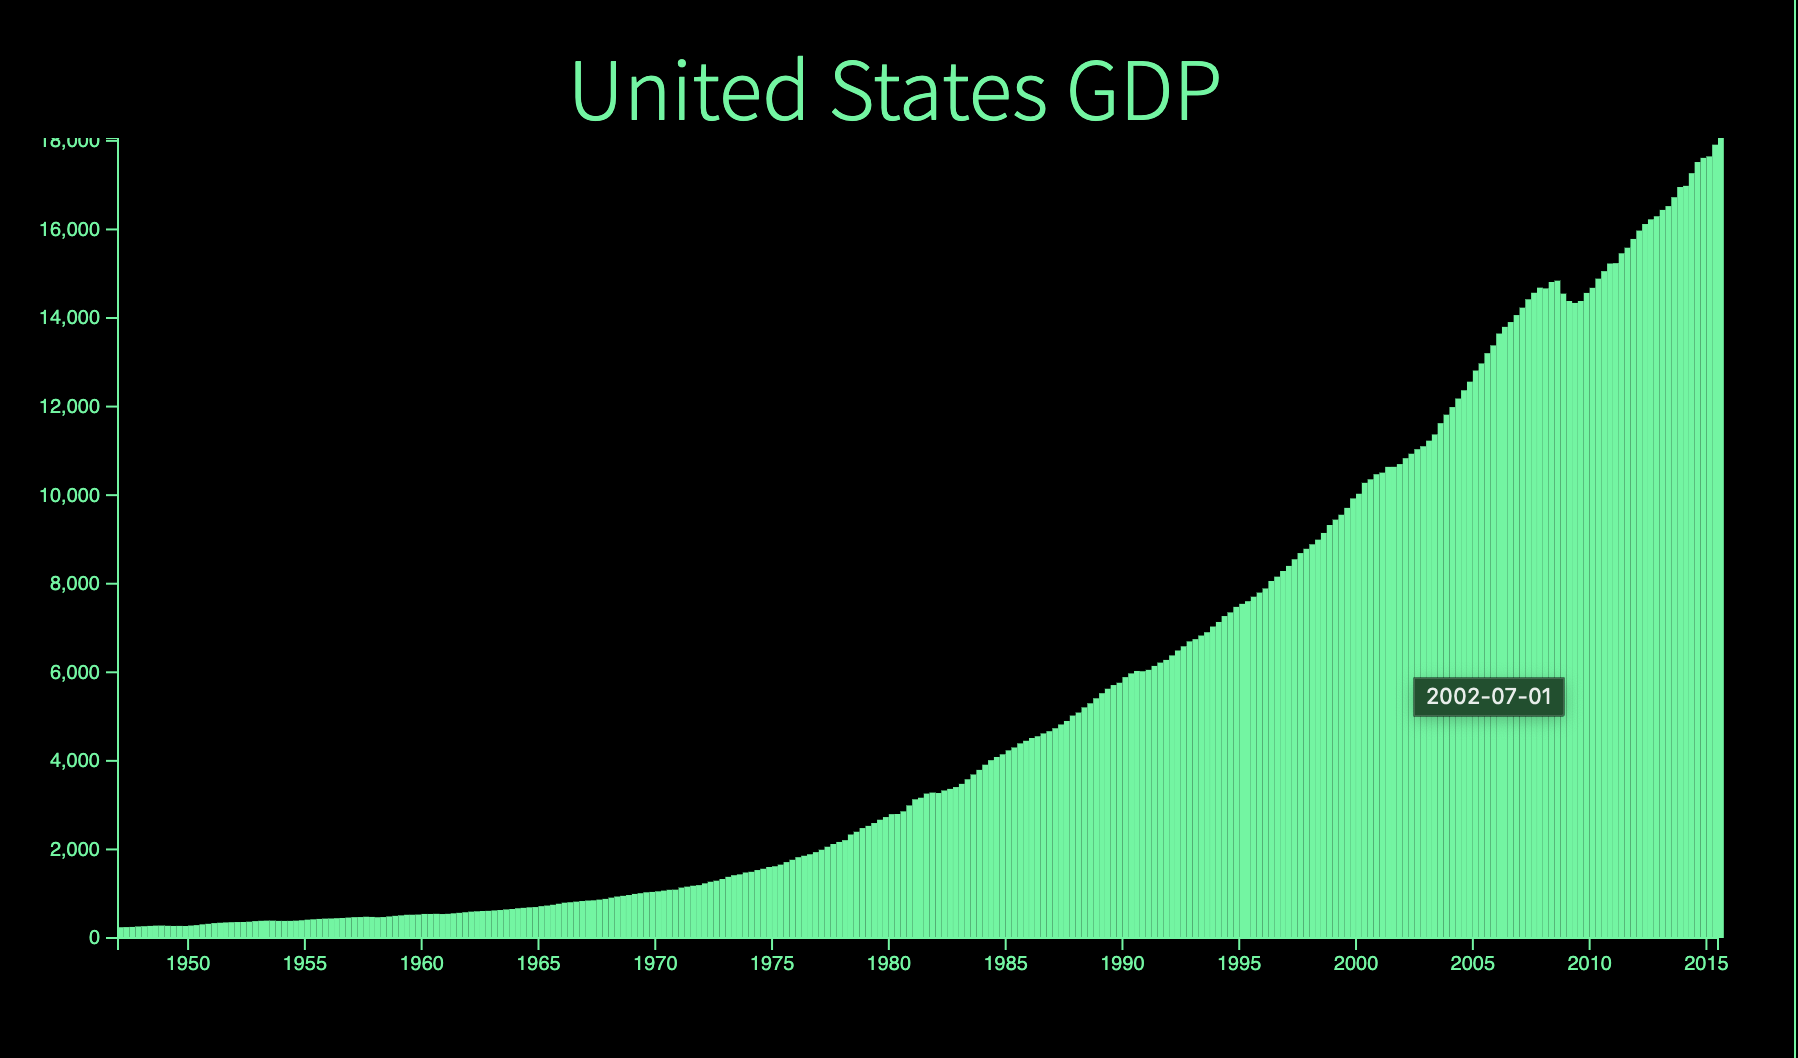
I’m doing this project on D3 - https://codepen.io/elgfm97/pen/RwovKKj (I have to build a bar chart from given data). I managed to pass all the tests except the last two (regarding the tooltip). I honestly can’t understand where the problem is, given that my chart shows the tooltip with the date when I hover the mouse on (as shown in the screenshot):

Here is the JS code:

let dataset = [];
let width = 800,
    height = 400;

fetch('https://raw.githubusercontent.com/freeCodeCamp/ProjectReferenceData/master/GDP-data.json').then(
    response => response.json()).then(
    data => {
        for (let i = 0; i < data.data.length; i++) {
            dataset.push(data.data[i]);
        }

        let barWidth = width / dataset.length;

        const svg = d3
            .select('#chart')
            .append('svg')
            .attr('width', width + 100)
            .attr('height', height + 60);


        const dates = dataset.map(item => new Date(item[0]));

        const xMax = new Date(d3.max(dates));
        const xMin = new Date(d3.min(dates));
        // xMax.setMonth(xMax.getMonth() + 3);
        const xScale = d3
            .scaleTime()
            .domain([xMin, xMax])
            .range([0, width]);

        const xAxis = d3.axisBottom().scale(xScale);

        svg.append('g')
            .call(xAxis)
            .attr('id', 'x-axis')
            .attr('transform', 'translate(40, 400)');

        const gdp = dataset.map(item => item[1]);
        console.log(gdp);
        const yMax = d3.max(gdp);
        const linearScale = d3.scaleLinear().domain([0, yMax]).range([0, height]);
        const yScale = d3.scaleLinear().domain([0, yMax]).range([height, 0]);
        const yAxis = d3.axisLeft(yScale);
        svg.append('g')
            .call(yAxis)
            .attr('id', 'y-axis')
            .attr('transform', 'translate(40, 0)');

        let scaledGDP = gdp.map(function (item) {
                return linearScale(item);
            });

            d3.select('svg')
                .selectAll('rect')
                .data(scaledGDP)
                .enter()
                .append('rect')
                .attr('data-date', function (d, i) {
                        return dataset[i][0];
                })
                .attr('data-gdp', function (d, i) {
                        return dataset[i][1];
                })
                .attr('class', 'bar')
                .attr('x', function (d, i) {
                        return xScale(dates[i]);
                })
                .attr('y', function (d) {
                        return height - d;
                })
                .attr('width', barWidth)
                .attr('height', function (d) {
                        return d;
                })
                .style('fill', '#00FA9A')
                .attr('transform', 'translate(40, 0)')
                .on('mouseover', function (d, i) {
                    svg.selectAll('rect')
                        .append("title")
                        .text(function (d, i) {
                            return dataset[i][0];
                        })
                        .attr('id', 'tooltip')
                        .attr('data-date', function (d, i) {
                            return dataset[i][0];
                        });
                    });
        });

Can somebody tell me where the problem is?

This is where the problems are. Since a title is just a JS popup from D3, it doesn’t have assignable ids and attributes. This code actually creates a title with the text, then adds an id and data-date attribute to the rects that you have selected. Since you are doing this in the loop over the bars already, you’re looping over every bar on every bar which is usually not desired.

The typical solution is to create a tooltip div and set its properties via mouse event functions, avoiding titles. Also note that since you’re using D3v6, those event functions have the signature (event, datum) => {...} not the old (datum, index) => {...} that it appears you are using.

There are many posts in the forums discussing this very issue if you need more information or examples.

I tried to refactor my code as you suggested, so I got rid of the loop inside mouseover function, I created the tooltip div as a variable and I’m trying to set its text to the given date, however there is no text displayed when i hover the mouse over a bar, and the tests still don’t pass.

Here is my new version of JS code:

let dataset = [];
let width = 800,
    height = 400;

let tooltip = d3
  .select('.chart')
  .append('div')
  .attr('id', 'tooltip')

fetch('https://raw.githubusercontent.com/freeCodeCamp/ProjectReferenceData/master/GDP-data.json').then(
    response => response.json()).then(
    data => {
        for (let i = 0; i < data.data.length; i++) {
            dataset.push(data.data[i]);
        }

        let barWidth = width / dataset.length;

        const svg = d3
            .select('#chart')
            .append('svg')
            .attr('width', width + 100)
            .attr('height', height + 60);


        const dates = dataset.map(item => new Date(item[0]));

        const xMax = new Date(d3.max(dates));
        const xMin = new Date(d3.min(dates));
        // xMax.setMonth(xMax.getMonth() + 3);
        const xScale = d3
            .scaleTime()
            .domain([xMin, xMax])
            .range([0, width]);

        const xAxis = d3.axisBottom().scale(xScale);

        svg.append('g')
            .call(xAxis)
            .attr('id', 'x-axis')
            .attr('transform', 'translate(40, 400)');

        const gdp = dataset.map(item => item[1]);
        console.log(gdp);
        const yMax = d3.max(gdp);
        const linearScale = d3.scaleLinear().domain([0, yMax]).range([0, height]);
        const yScale = d3.scaleLinear().domain([0, yMax]).range([height, 0]);
        const yAxis = d3.axisLeft(yScale);
        svg.append('g')
            .call(yAxis)
            .attr('id', 'y-axis')
            .attr('transform', 'translate(40, 0)');

        let scaledGDP = gdp.map(function (item) {
                return linearScale(item);
            });

            d3.select('svg')
                .selectAll('rect')
                .data(scaledGDP)
                .enter()
                .append('rect')
                .attr('data-date', function (d, i) {
                        return dataset[i][0];
                })
                .attr('data-gdp', function (d, i) {
                        return dataset[i][1];
                })
                .attr('class', 'bar')
                .attr('x', function (d, i) {
                        return xScale(dates[i]);
                })
                .attr('y', function (d) {
                        return height - d;
                })
                .attr('index', (d, i) => i)
                .attr('width', barWidth)
                .attr('height', function (d) {
                        return d;
                })
                .style('fill', '#00FA9A')
                .attr('transform', 'translate(40, 0)')
                .on('mouseover', function (event, d) {
                         var i = this.getAttribute('index');
                        
                        tooltip
                        .text(function (d, i) {
                            return dataset[i][0];
                        })
                        .attr('data-date', function (d, i) {
                            return dataset[i][0];
                        });
              
                        this.append(function() {return tooltip});
                    });
        });

This is a class selector, not an id selector (this is causing most of your problems now). Also, the tooltip has to be invisible if the pointer is not on a bar.

This is causing you to jump through extra hoops later (like passing indices around) since you are not directly iterating over the data set. It’s much easier to iterate over your data set and use functions to transform the data as you iterate (scales, etc.).

You’ll need to control visibility here and when the pointer leaves the bar as well. There’s no data displayed since your tooltip is not correctly defined earlier. You can always drop a console.log() in a function to see what is happening.

I saw this tutorial - https://chartio.com/resources/tutorials/how-to-show-data-on-mouseover-in-d3js/ , and I tried to follow this guide, so I defined a tooltip selecting by id this time, and i’ve put its visibility to hidden. Next, I decided to create another d3 selection to make things clearer, I selected all divs and I tried to append div setting its text to the date from dataset, and then on mouseover I tried to make it visible again, but somehow that doesn’t work. And also, console.log(tooltip.text) shows nothing…

Modified code:

let dataset = [];
let width = 800,
    height = 400;

let tooltip = d3
  .select('#chart')
  .append('div')
  .attr('id', 'tooltip')
  .style("visibility", "hidden");

fetch('https://raw.githubusercontent.com/freeCodeCamp/ProjectReferenceData/master/GDP-data.json').then(
    response => response.json()).then(
    data => {
        for (let i = 0; i < data.data.length; i++) {
            dataset.push(data.data[i]);
        }

        let barWidth = width / dataset.length;

        const svg = d3
            .select('#chart')
            .append('svg')
            .attr('width', width + 100)
            .attr('height', height + 60);


        const dates = dataset.map(item => new Date(item[0]));

        const xMax = new Date(d3.max(dates));
        const xMin = new Date(d3.min(dates));
        // xMax.setMonth(xMax.getMonth() + 3);
        const xScale = d3
            .scaleTime()
            .domain([xMin, xMax])
            .range([0, width]);

        const xAxis = d3.axisBottom().scale(xScale);

        svg.append('g')
            .call(xAxis)
            .attr('id', 'x-axis')
            .attr('transform', 'translate(40, 400)');

        const gdp = dataset.map(item => item[1]);
        console.log(gdp);
        const yMax = d3.max(gdp);
        const linearScale = d3.scaleLinear().domain([0, yMax]).range([0, height]);
        const yScale = d3.scaleLinear().domain([0, yMax]).range([height, 0]);
        const yAxis = d3.axisLeft(yScale);
        svg.append('g')
            .call(yAxis)
            .attr('id', 'y-axis')
            .attr('transform', 'translate(40, 0)');

        let scaledGDP = gdp.map(function (item) {
                return linearScale(item);
            });

            d3.select('svg')
                .selectAll('rect')
                .data(scaledGDP)
                .enter()
                .append('rect')
                .attr('data-date', function (d, i) {
                        return dataset[i][0];
                })
                .attr('data-gdp', function (d, i) {
                        return dataset[i][1];
                })
                .attr('class', 'bar')
                .attr('x', function (d, i) {
                        return xScale(dates[i]);
                })
                .attr('y', function (d) {
                        return height - d;
                })
                .attr('width', barWidth)
                .attr('height', function (d) {
                        return d;
                })
                .style('fill', '#00FA9A')
                .attr('transform', 'translate(40, 0)');
      
      d3.select('svg')
        .selectAll('div')
        .data(scaledGDP)
        .enter()
        .append('div')
        .text(function(d, i) {
          return dataset[i][0];
      })
      .on("mouseover", function(d) {
        tooltip.text(d);
        return tooltip.style("visibility", "visible");
     
      })


                    });


Since this is outside of the selectAll/data/enter on the bars, you are creating a set of invisible divs (or trying to; the original has an id, so it may not work) and then setting a mouseover function for them. But since they are invisible (or maybe non-existent) you can’t mouse over them and if you could, they aren’t connected to the bars as they should be.

You need to have the div created in the beginning like you do, then as you are creating the bars, create the mouse event functions that change the tooltip div attached to events on the bars, not the tooltip div. You want to control display of that tooltip div with what the mouse is doing in relation to a bar.

This topic was automatically closed 182 days after the last reply. New replies are no longer allowed.