Kindly someone help
Thanks
If cell 21 is dependent on previous cells you need to make sure to run all cells.
Yes l have tried running all the cells but the plot/graph doesn’t show up
Thank You
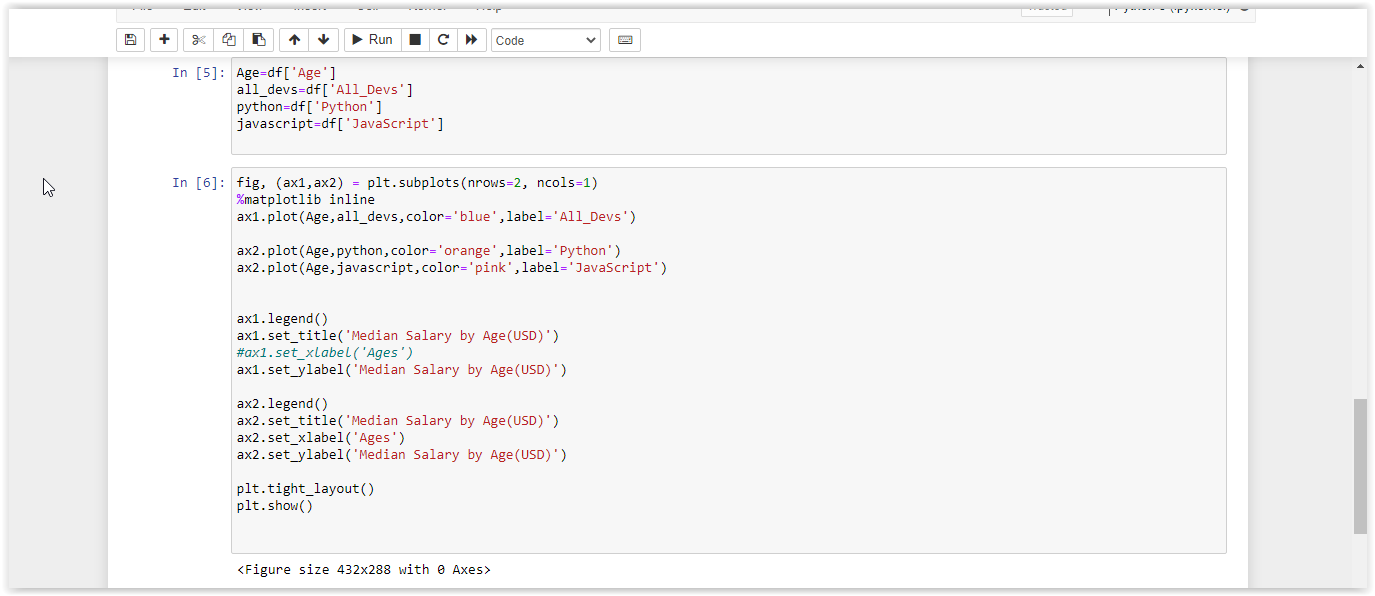
I mean, it’s saying your graph doesn’t have any “Axes” which actually refers to the “cell” of the figure in which the graph is shown. Soooo it’s got nothing to show.
I feel like the way you use ax1 and ax2 implies you should use the plt.subplots() beforehand to innitiate those… though I might be wrong, I’d have to check making such graphs again myself.
Anyway, you are not getting an error, but an empty figure. Thus the code is just missing some information.
Where is the data?
I can see plenty of setup stuff, but no data to graph.
This is the full code the data and the graphs
%matplotlib notebook
%matplotlib inline
from matplotlib import pyplot as plt
import pandas as pd
df=pd.read_csv('data2.csv')
df
Age=df['Age']
all_devs=df['All_Devs']
python=df['Python']
javascript=df['JavaScript']
fig, (ax1,ax2) = plt.subplots(nrows=2, ncols=1)
%matplotlib inline
ax1.plot(Age,all_devs,color='blue',label='All_Devs')

ax2.plot(Age,python,color='orange',label='Python')
ax2.plot(Age,javascript,color='pink',label='JavaScript')


ax1.legend()
ax1.set_title('Median Salary by Age(USD)')
#ax1.set_xlabel('Ages')
ax1.set_ylabel('Median Salary by Age(USD)')

ax2.legend()
ax2.set_title('Median Salary by Age(USD)')
ax2.set_xlabel('Ages')
ax2.set_ylabel('Median Salary by Age(USD)')

plt.tight_layout()
plt.show()