I have built a strip plot using Python. I need to add in a couple of lines of code that will add conditional formatting to the markers if:
The units (markers - Stars) are based on the unit scores. The markers are colored Blue for West and Gold for East. The unit scores are based on the experience level of 9 labor categories, and three paybands. I need to write the code to return the markers for all of the units that have any of the 9 labor categories with a red border with labor category score less than or = to 0 (<=). I need to write code to return the markers for all of the units that have any of the 3 paybands with the markers filled with the Hatch pattern that have a score less than or =equal to 0 (<=). Return the units (markers) that have a score greater than 0 (>) in the labor categories, and paybands as Blue markers (Stars) for the West units and Gold markers (Stars) for East units.
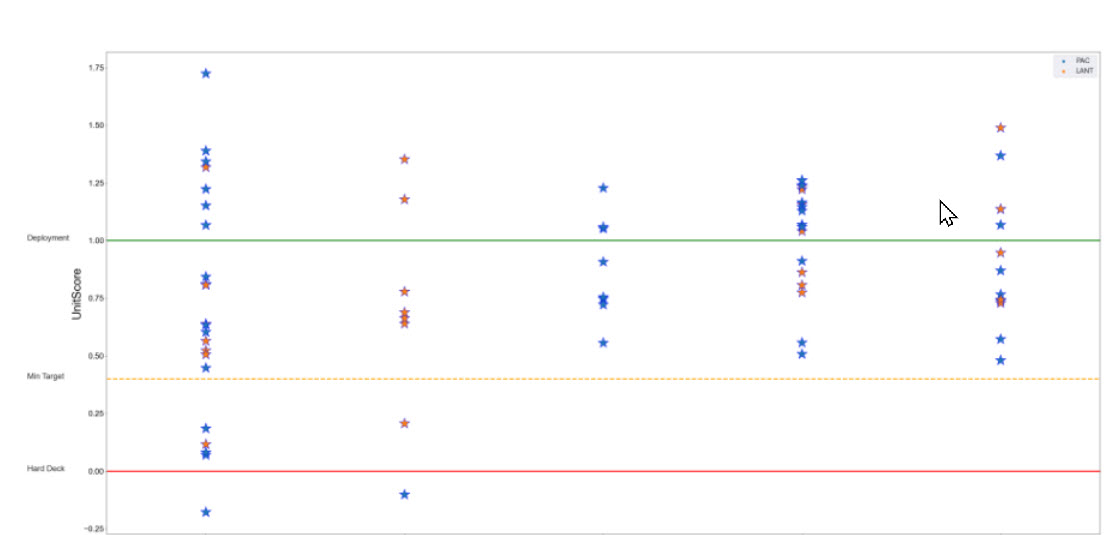
Here is the code I have written. Is there someone here who would know how to write the conditional statements? I have attached a copy of the visual based on my code.
# dataset = pandas.DataFrame(Phase, Unit, UnitScore)

# dataset = dataset.drop_duplicates()

# Paste or type your script code here:

# The following code to create a dataframe and remove duplicated rows is always executed and acts as a preamble for your script:

# dataset = pd.DataFrame(Phase, Unit, UnitScore)

# dataset = dataset.drop_duplicates()

# Paste or type your script code here:

import matplotlib.pyplot as plt

import seaborn as sns

import pandas as pd

from matplotlib.pyplot import text

plt.figure(figsize=(45,22))

st=sns.stripplot(x='Phase', y='UnitScore', hue='UnitCoast', data=dataset, size=28, marker="*", edgecolor=('Blue'), linewidth=1, alpha=1, jitter=0)

plt.yticks(fontsize=30)

sns.set(font_scale=1.6)

plt.axhline(1, color="Green", linewidth=3)

matplotlib.pyplot.text(x=-.9, y=1, s='Deployment', fontsize=20)

plt.axhline(.4, color="Orange", linestyle='dashed', linewidth=3)

matplotlib.pyplot.text(x=-.9, y=.4, s='Min Target', fontsize=20)

plt.axhline(0, color="Red", label='Hard Deck', linewidth=3)

matplotlib.pyplot.text(x=-.9, y=0, s='Hard Deck', fontsize=20)

plt.xlabel('Phase', fontsize=30);

plt.ylabel('UnitScore', fontsize=30);

plt.tick_params(axis='both', which='major', labelsize=20)

x=dataset['Phase'].values

y=dataset['UnitScore'].values

z=dataset['Unit'].values

for ph, us, un in zip(x, y, z):

plt.annotate(un, (ph,us), xytext=(10,2), textcoords="offset points")

plt.show()