Tell us what’s happening:
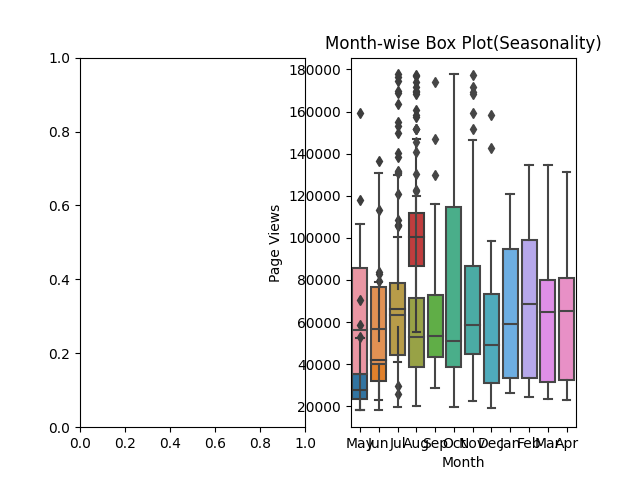
I was plotting two boxplot side by side , by it getting plotted only one plot. Can any help in this issue.
Your code so far
def draw_box_plot():
# Prepare data for box plots (this part is done!)
df_box = df.copy()
df_box.reset_index(inplace=True)
df_box[‘year’] = [d.year for d in df_box.date]
df_box[‘month’] = [d.strftime(’%b’) for d in df_box.date]
# Draw box plots (using Seaborn)
fig , (ax1, ax2) = plt.subplots(1,2)

ax1 = sns.boxplot(x='year',y='value',data=df_box)
ax1.set_xlabel('Year')
ax1.set_ylabel('Page Views')
ax1.set_title('Year-Wise Box Plot(Trends)')


ax2 = sns.boxplot(x='month', y='value', data=df_box)
ax2.set_xlabel('Month')
ax2.set_ylabel('Page Views')
ax2.set_title('Month-wise Box Plot(Seasonality)')


# Save image and return fig (don't change this part)
fig.savefig('box_plot.png')
return fig
Your browser information:
User Agent is: Mozilla/5.0 (Windows NT 10.0; Win64; x64) AppleWebKit/537.36 (KHTML, like Gecko) Chrome/85.0.4183.83 Safari/537.36.
Challenge: Page View Time Series Visualizer
Link to the challenge:
https://www.freecodecamp.org/learn/data-analysis-with-python/data-analysis-with-python-projects/page-view-time-series-visualizer
 Feel free to discuss