Tell us what’s happening:
I’m currently on the 2nd function, draw_bar_plot. I feel that the main thing I am not understanding is how to group the data by year in seaborn (or matplotlib would also be fine). I think if I understood how to do that, the other details would fall into place. I also feel like I am probably not doing things the most effective way as you might see indicated in my comments.
Here is my current output:
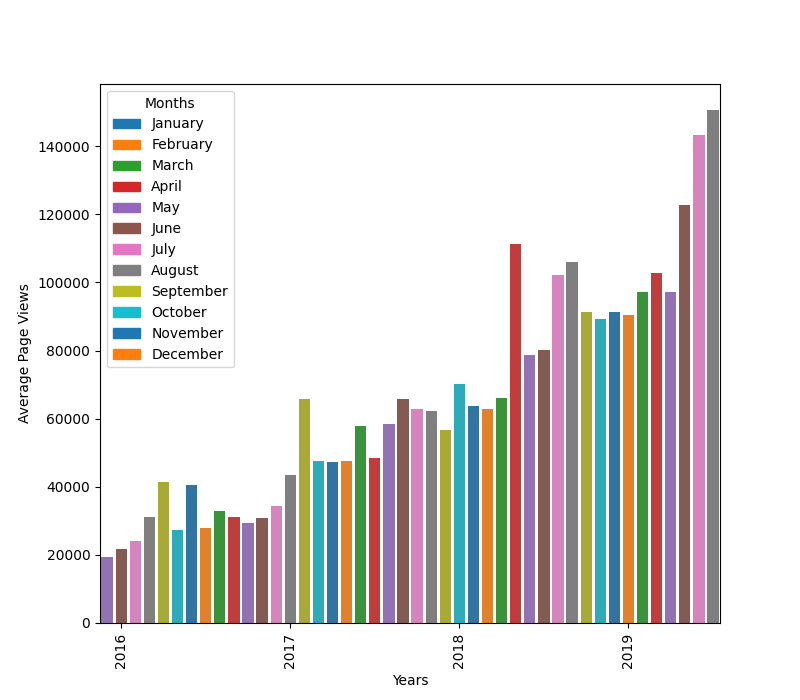
This is close, but has two problems: a) it is not grouped by year and b) the colour pattern does not restart each year.
I can’t figure out how to get them grouped by year like that with either matplotlib or seaborn. It might be that I simply need to reorganize the data in pandas somehow, but I’m drawing a blank on what would get it right.
Any pointers on what to try or search?
Your code so far
def draw_bar_plot():
    # Copy and modify data for monthly bar plot
    df_bar = df.copy()

    # adding year and month column
    df_bar.reset_index(inplace=True)
    df_bar['year'] = [d.year for d in df_bar.date]
    df_bar['month'] = [d.month for d in df_bar.date]
    df_bar["month_name"] = [d.strftime('%B') for d in df_bar.date]

    # mean by month per year
    mean_bars = df_bar.groupby(["year", "month"]).mean().reset_index()
    # TODO: There's gotta be a better way to do this...
    mean_bars["date"] = pd.Series(str(int(row["year"])) + "-" + str(int(row["month"])).zfill(2) for idx, row in mean_bars.iterrows())

    # Draw bar plot redo
    # set the color palette
    # TODO: how to change order of colours to sync with months?
    palette = sns.color_palette("tab10")

    # TODO: This still isn't right because we want to start at palette[0] = January
    # but it wraps around such that November = January
    # Right now, it gets to Nov, Dec, Jan... but the wrap happens at November incorrectly
    # this would probably be fixed by correctly grouping by year

    # Potentially this is still needed for first data alignment, so keeping it
    # color alignment will be such that the palette starts at month 1 (January)
    # so, determine the first month present in the dataset so we can reorder
    # the palette for the bar plot
    # -1 because 0 indexed
    first_month = int(mean_bars["date"].iloc[0][-2:]) - 1
    reordered_palette = palette[first_month:] + palette[:first_month]

    # TODO: how to group by the year, but keep on same figure?
    ax = sns.barplot(x="date", y="value", dodge=False, data=mean_bars, palette=reordered_palette)

    # set ticks halfway through the year
    xticks = []
    for idx, full_date in enumerate(mean_bars["date"]):
        if full_date[-2:] == "06":
            xticks.append(idx)
    ax.set_xticks(xticks)

    # use year as the label and make them vertical
    years = df_bar["year"].unique()
    ax.set_xticklabels(years, rotation=90)

    # setting plot labels
    ax.set_xlabel("Years")
    ax.set_ylabel("Average Page Views")

    # sync colors to month order
    months = ["January", "February", "March", "April", "May", "June", "July", "August", "September", "October", "November", "December"]
    handles = []
    for idx, month in enumerate(months):
        # mod 10 because we only want 10 color patches for some reason to match the answer
        handles.append(mpatches.Patch(color=palette[idx % 10], label=month))

    # set the legend accordingly
    ax.legend(handles=handles, title="Months")

    # not sure why I seem to need this to wipe an extraneous graph off the figure
    plt.figure()
    ax.figure.set_size_inches(8, 7)
    fig = ax.get_figure()

    # Save image and return fig (don't change this part)
    # DEBUG
    fig.savefig(os.getcwd() + '/debug/bar_plot.png')
    fig.savefig('bar_plot.png')
    return fig
Your browser information:
User Agent is: Mozilla/5.0 (X11; Ubuntu; Linux x86_64; rv:101.0) Gecko/20100101 Firefox/101.0
Challenge: Page View Time Series Visualizer
Link to the challenge: