Cuéntanos qué está pasando:
Describe tu problema en detalle aquí.
Tengo un error de dependencia y no se que hacer, hice una corrida en mi ordenador y cuando pasé el codigo a replit aparece un error que no se como resolver.
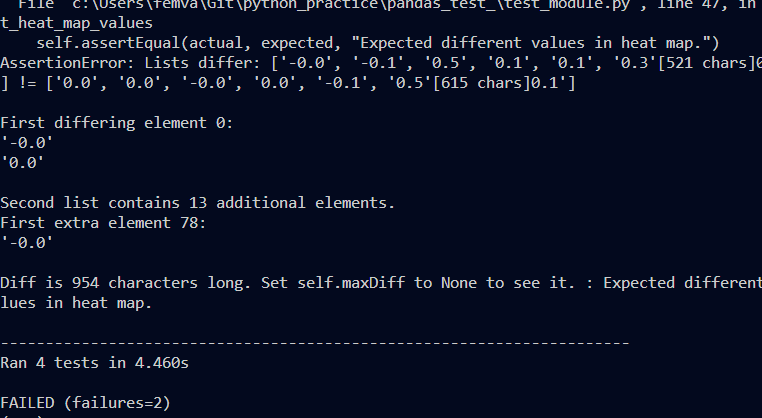
Este es el mensaje de error
Replit: Updating package configuration
--> python3 -m poetry add numpy
Using version ^1.23.2 for numpy
Updating dependencies
Resolving dependencies...
SolverProblemError
The current project's Python requirement (>=3.7,<4.0) is not compatible with some of the required packages Python requirement:
- numpy requires Python >=3.8, so it will not be satisfied for Python >=3.7,<3.8
Because numpy (1.23.2) requires Python >=3.8
and no versions of numpy match >1.23.2,<2.0.0, numpy is forbidden.
python main.py
Traceback (most recent call last):
File "main.py", line 6, in <module>
medical_data_visualizer.draw_cat_plot()
File "/home/runner/boilerplate-medical-data-visualizer/medical_data_visualizer.py", line 37, in draw_cat_plot
count = df_cat.get_group(i).value_counts()
File "/home/runner/boilerplate-medical-data-visualizer/venv/lib/python3.8/site-packages/pandas/core/generic.py", line 5179, in __getattr__
return object.__getattribute__(self, name)
AttributeError: 'DataFrame' object has no attribute 'value_counts'
exit status 1
=================================================
Tu código hasta el momento
Mi codigo hasta el momento
import pandas as pd
import seaborn as sns
import matplotlib.pyplot as plt
import numpy as np

# Import data
df = pd.read_csv('medical_examination.csv',index_col=0)

# Add 'overweight' column
df['overweight'] =  0
df.loc[(df['weight']/((df['height']/100)**2) >25),'overweight'] = 1

# Normalize data by making 0 always good and 1 always bad. If the value of 'cholesterol' or 'gluc' is 1, make the value 0. If the value is more than 1, make the value 1.

df.loc[(df['cholesterol']==1), 'cholesterol'] = 0
df.loc[(df['cholesterol']>1), 'cholesterol'] = 1

df.loc[(df['gluc']==1), 'gluc'] = 0
df.loc[(df['gluc']>1), 'gluc'] = 1

# Filter Data
df.drop(index = df[( ~(df['ap_lo'] <= df['ap_hi'])|~(df['height'] >= df['height'].quantile(0.025))|~(df['height'] <= df['height'].quantile(0.975))|~(df['weight'] >= df['weight'].quantile(0.025))|~(df['weight'] <= df['weight'].quantile(0.975)))].index, inplace = True  )

# Draw Categorical Plot
def draw_cat_plot():

    # Create DataFrame for cat plot using `pd.melt` using just the values from 'cholesterol', 'gluc', 'smoke', 'alco', 'active', and 'overweight'.
  df_cat = pd.melt(df,value_vars=['active', 'alco', 'cholesterol','gluc','overweight','smoke'],id_vars='cardio')


    # Group and reformat the data to split it by 'cardio'. Show the counts of each feature. You will have to rename one of the columns for the catplot to work correctly.
  df_cat = df_cat.groupby('cardio')
  d_temp_ = pd.DataFrame()
-------------------------------------------------------------  Aqui marca el error
  for i,x_ in df_cat:
    # Series
==>    count = df_cat.get_group(i).value_counts()
-------------------------------------------------------------
    # Series to D.Frame
    for k,m in count.iteritems():
      d_temp_ = d_temp_.append({ 'cardio': i ,'variable': k[1],'value': k[2],'total': m},ignore_index=True)

  # Entero
  d_temp_['cardio'] = pd.to_numeric(d_temp_['cardio'], downcast='integer')
  d_temp_['value'] = pd.to_numeric(d_temp_['value'], downcast='integer')

  # Draw the catplot with 'sns.catplot()'
  cp = sns.catplot(x='variable', kind='bar', hue='value', y='total', col='cardio', order= ['active','alco','cholesterol','gluc','overweight','smoke'] , data=d_temp_)
  # Get the figure for the output
  fig = cp.fig

  # Do not modify the next two lines
  fig.savefig('catplot.png')
  return fig


# Draw Heat Map
def draw_heat_map():
    # Clean the data
    df_heat =  df.copy()

    # Calculate the correlation matrix
    corr = df_heat.corr()

    # Generate a mask for the upper triangle
    mask = np.triu(df_heat.corr())

    # Set up the matplotlib figure
    fig, ax = plt.subplots(figsize=(10.0, 10.0))

    # Draw the heatmap with 'sns.heatmap()'
    sns.heatmap(ax=ax, data=corr, annot=True, fmt='.1f', mask=mask)

    # Do not modify the next two lines
    fig.savefig('heatmap.png')
    return fig
=================================================
Información de tu navegador:
El agente de usuario es: Mozilla/5.0 (Windows NT 10.0; Win64; x64; rv:104.0) Gecko/20100101 Firefox/104.0
Desafío: Proyectos de análisis de datos con Python - Visualizador de datos médicos
Enlaza al desafío:
[https://replit.com/@mazakotten/boilerplate-medical-data-visualizer](https://Medical Visualizer)