Here’s the code I’ve written
import pandas as pd
import matplotlib.pyplot as plt
from scipy.stats import linregress

def draw_plot():
    # Read data from file
    df = pd.read_csv('epa-sea-level.csv')

    # Create scatter plot
    df.plot.scatter(x='Year', y='CSIRO Adjusted Sea Level', figsize=(15, 7))

    # Create first line of best fit

    slope, intercept, *others = linregress(df['Year'], df['CSIRO Adjusted Sea Level'])
    x = pd.Series(range(1880, 2050))
    y = x*slope + intercept
    plt.plot(x, y, color='#f00')

    # Create second line of best fit
    slope, intercept, *others = linregress(df[df['Year']>=2000]['Year'], df[df['Year']>=2000]['CSIRO Adjusted Sea Level'])
    x = pd.Series(range(2000, 2050))
    y = intercept + slope*x
    plt.plot(x, y, color='#0f0')

    # Add labels and title
    plt.xlabel('Year')
    plt.ylabel('Sea Level (inches)')
    plt.title('Rise in Sea Level')

    # Save plot and return data for testing (DO NOT MODIFY)
    plt.savefig('sea_level_plot.png')
    return plt.gca()
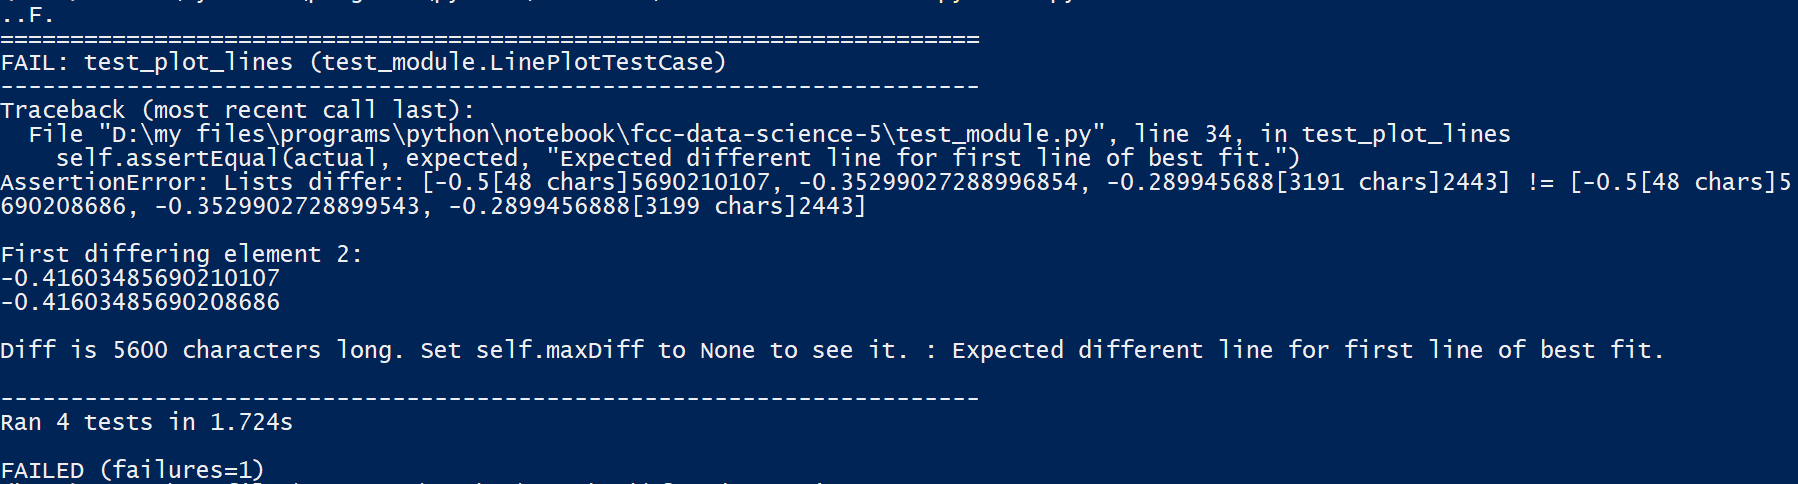
Here’s the test failure I got:
Some calculations which could be useful for rectifying the error:
Though the difference is very small, but the tests are designed to avoid that… I’ve tried other solutions from the forum, but None seems to work…
That test is telling you that you are one year short. The predictions are supposed to go through 2050 and the python
only goes through 2049 because of how range() works.
@jeremy.a.gray,
That’s not the issue, I’ve gone through other posts for this project in the forum.
This is drawback of this test that, it just checks for the range from 1880 to 2049…
Error I got is regarding the data points…
If I include 2050 in my code as you suggested then, following is the line appended to existing error:

170th element is the index for 2050 in range(1880, 2050)
Actually, there are several things. First, it would help if I read the whole error. I looked at the end of your error and it matched the one I generated, but for different reasons. I went back and looked at the error you are getting and it looks like a floating point error (difference? rounding? in the thirteenth decimal place), so your calculation is not wrong (your code works on my machine and passes) but there is some implementation difference between your calculation and the original (software or hardware, but not your code).
I would change the offending test to use assertAlmostEqual() instead of assertEqual() and use as many decimal places as is convincing to you. This is often necessary when comparing floats anyway.
The array size is off by one, but it’s not your code, it’s the project code. I grabbed the original tests and checked the test requirements and they actually stop in 2049. I verified that by printing the years that generate passing (original) tests . Or, you can think of it as inclusive subtraction (2050 - 1880 = 170, but add one to include the 1880, so 171). I added another element to the test and changed my code, so that’s why I got the off by one error.
Regardless, your code is correct, you just need to convince the tests.
I pasted the code on repl.it, and it passed the tests…
I guess, there was just issue with either the python version(v3.8 on replit and v3.9 on my pc), Or the difference might be due to different platforms(I’m using Windows)
Finally I convinced the tests 
Thank you!!