Passing 9 out of 14, but I suspect they may be inter-related
failing on the last five
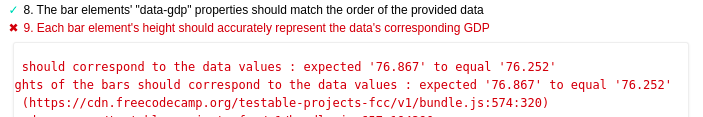
#10, #11 & #12
yScale.domain([yMin - 150, yMax + 1000]);
I tried adjusting the yScale.domain but the more I played with the numbers, the further off they seemed to get…
yScale.domain([yMin , yMax]);
meaning instead of these numbers being off by a couple of decimals, it was more like doubled… I’ll try to update with another screen capture when I’m testing again. Or at least get better references for which changes generated which numbers. But Min -150 and Max +1000 was the only thing even in the ballpark.
relevant section? (less sure about this one)
  // // section 6 Adjusting the height and the width of the bars

  var yScale = d3.scaleLinear(); //create a linear scale
  yScale.range([HEIGHT, 0]); //set its visual range to 600 -> 0 (remember bottom of svg is 600px down from top)
  var yMin = d3.min(data, function (datum, index) { //get the minimum y data value...
    // console.log(datum[1]);
    return datum[1]; //by looking at the count property of each datum
  });
  var yMax = d3.max(data, function (datum, index) { //get the maximum y data value...
    // console.log(datum[1]);
    return datum[1]; //by looking at the count property of each datum
  });
  yScale.domain([yMin - 150, yMax + 1000]); //set the domain of yScale from yMin and yMax
#13 & #14
I’m getting a tooltip that shows the GDP and it has the id='tool-tip' so I’m not sure why it’s still failing the first one under the tooltip. I tried changing title to tooltip but then it didn’t even show up at all for mouseover. At least now it shows up, but still not passing the automation.

relevant section! more sure about this one…
  // // section 6 add a tooltip based on the Quarter of GDP's date

  d3.selectAll('rect') //find all rectangles
    .append("title")
    .attr('id', 'tooltip')
    .attr('data-date', function (datum, index) { //get the height of each rectangle...
      let QUARTER = datum[0];
      return QUARTER;
    })
    .text(function (datum) { //get the height of each rectangle...
      let QUARTER = datum[0];
      // console.log(datum[0]);
      // // console.log(QUARTER);
      return 'data-date: ' + QUARTER;
    }); //
This is one of the hints that made me think they could both be different manifestations of a related bug, it’s seeing 1947 as 1981?

BarChart: Data Visualization with D3 Challenges at freeCodeCamp.com
repo: https://github.com/TurtleWolfe/D3BarChart
live demo: https://turtlewolfe.github.io/D3BarChart best viewed in Chrome
javaScript.js full file for reference and in case it’s somewhere else
var WIDTH = 800;
var HEIGHT = 400;

// set width and height of svg
d3.select('svg')
  .style('width', WIDTH)
  .style('height', HEIGHT);

// fetch data
// // section 4 Making an AJAX request

d3.json('https://raw.githubusercontent.com/freeCodeCamp/ProjectReferenceData/master/GDP-data.json').then(function (data) {

  // console.log(data);
  // console.log(data.data);
  data = data.data;
  console.log(data);
  //once data is retrieved...
  // // section 5 Using AJAX data to create SVG elements

  d3.select('svg').selectAll('rect') //select rectangles within svg (even if none exist)
    .data(data) //attach data to the rectangles
    .enter() //find the data elements that are not attached to rectangles
    .append('rect') //append rectangles for each data not attached to a rectangle
    .attr('class', 'bar'); //add attribute class='bar' to each rectangle


  // // section 6 Adjusting the height and the width of the bars

  var yScale = d3.scaleLinear(); //create a linear scale
  yScale.range([HEIGHT, 0]); //set its visual range to 600 -> 0 (remember bottom of svg is 600px down from top)
  var yMin = d3.min(data, function (datum, index) { //get the minimum y data value...
    // console.log(datum[1]);
    return datum[1]; //by looking at the count property of each datum
  });
  var yMax = d3.max(data, function (datum, index) { //get the maximum y data value...
    // console.log(datum[1]);
    return datum[1]; //by looking at the count property of each datum
  });
  yScale.domain([yMin - 150, yMax + 1000]); //set the domain of yScale from yMin and yMax


  // // section 6 Adjusting the height and the width of the bars

  d3.selectAll('rect') //find all rectangles
    .attr('height', function (datum, index) { //set the height of each rectangle...
      //...by getting the count property of each datum
      //converting it to a visual value, using yScale
      //(remember, when using yScale as it is set up, a large data value will give you a small visual value and vice versa)
      //then subtract that value from HEIGHT
      //this will make a large bar for a large data value
      console.log(datum[1]);
      return HEIGHT - yScale(datum[1]);
    });


  // // section 6 Adjusting the height and the width of the bars

  d3.selectAll('rect') //find all rectangles
    .attr('data-gdp', function (datum, index) { //set the height of each rectangle...
      let GDP = datum[1];
      // console.log(datum[1]);
      // // console.log(GDP);
      return GDP;
    });

  // // section 6 Adjusting the height and the width of the bars

  d3.selectAll('rect') //find all rectangles
    .attr('data-date', function (datum, index) { //set the height of each rectangle...
      let QUARTER = datum[0];
      // console.log(datum[1]);
      // // console.log(QUARTER);
      return QUARTER;
    });

  // // section 6 add a tooltip based on the Quarter of GDP's date

  d3.selectAll('rect') //find all rectangles
    .append("title")
    .attr('id', 'tooltip')
    .attr('data-date', function (datum, index) { //get the height of each rectangle...
      let QUARTER = datum[0];
      return QUARTER;
    })
    .text(function (datum) { //get the height of each rectangle...
      let QUARTER = datum[0];
      // console.log(datum[0]);
      // // console.log(QUARTER);
      return 'data-date: ' + QUARTER;
    }); //


  // // section 7 Adjusting the horizontal and the vertical placement of the bars

  var xScale = d3.scaleLinear(); //create the xScale
  xScale.range([0, WIDTH]); //set the range to 0->800
  xScale.domain([0, data.length]); //set the domain from 0 to the number of data elements retrieved
  d3.selectAll('rect') //select all rectangles
    .attr('x', function (datum, index) { //set the x position of each rectangle...
      return xScale(index);//by converting the index of the element in the array to a point between 0->800
    });


  // // section 7 Adjusting the horizontal and the vertical placement of the bars

  d3.selectAll('rect') //select all rectangles
    .attr('y', function (datum, index) { //set the y position of each rectangle...
      //by converting the count property of the datum to a visual value
      //(remember, when using yScale as it is set up, a large data value will give you a small visual value and vice versa)
      return yScale(datum[1]);
    });


  // // section 8 Making the width of the bars dynamic

  d3.selectAll('rect') //select all rectangles
    .attr('width', WIDTH / data.length); //set the width of all rectangles to be the width of the SVG divided by the number of data elements


  // // section 9 Changing the color of the bar based on data

  var yDomain = d3.extent(data, function (datum, index) { //set the y domain by getting the min/max with d3.extent
    return datum[1]; //... and examining the [1] property of each datum
  });
  var colorScale = d3.scaleLinear();//create a linear scale
  colorScale.domain(yDomain); //the domain is the yDomain
  colorScale.range(['#00cc00', 'blue']); //the visual range goes from green->blue
  d3.selectAll('rect') //select all rectangles
    .attr('fill', function (datum, index) { //set the fill of each rectangle
      return colorScale(datum[1]); //by converting the [1] property of the datum to a color
    });


  // // section 10 Adding axes

  var leftAxis = d3.axisLeft(yScale); //create a left axis generator using the yScale
  d3.select('svg') //select the svg
    .append('g').attr('id', 'x-axis') //append a <g> tag to it with id=left-axis
    .call(leftAxis); // create a left axis within that <g>


  // // section 10 Adding axes

  var skillScale = d3.scaleBand(); //create a scale band that will map skills to horizontal positions
  var skillDomain = data.map(function (skill) { //create an array of skill strings
    console.log(skill[0]);
    return skill[0];
  });
  skillScale.range([0, WIDTH]); //set the range of the skillScale to 0->800
  skillScale.domain(skillDomain); //set the domain to be the array of skill strings


  // // section 10 Adding axes

  var bottomAxis = d3.axisBottom(skillScale); //create a bottom axis generator that uses the skillScale
  d3.select('svg') //select the svg
    .append('g').attr('id', 'y-axis') //append a <g> tag to it with id=bottom-axis
    .call(bottomAxis) // create a bottom axis within that <g>
    .attr('transform', 'translate(0,' + HEIGHT + ')'); //move it to the bottom of the svg

});