Hi Guys, i need your help: i’m doing the project “Page View Time Series Visualizer” and i’m in trouble with an Error, and i’m not able to find anything on the web. The error in console is the following:
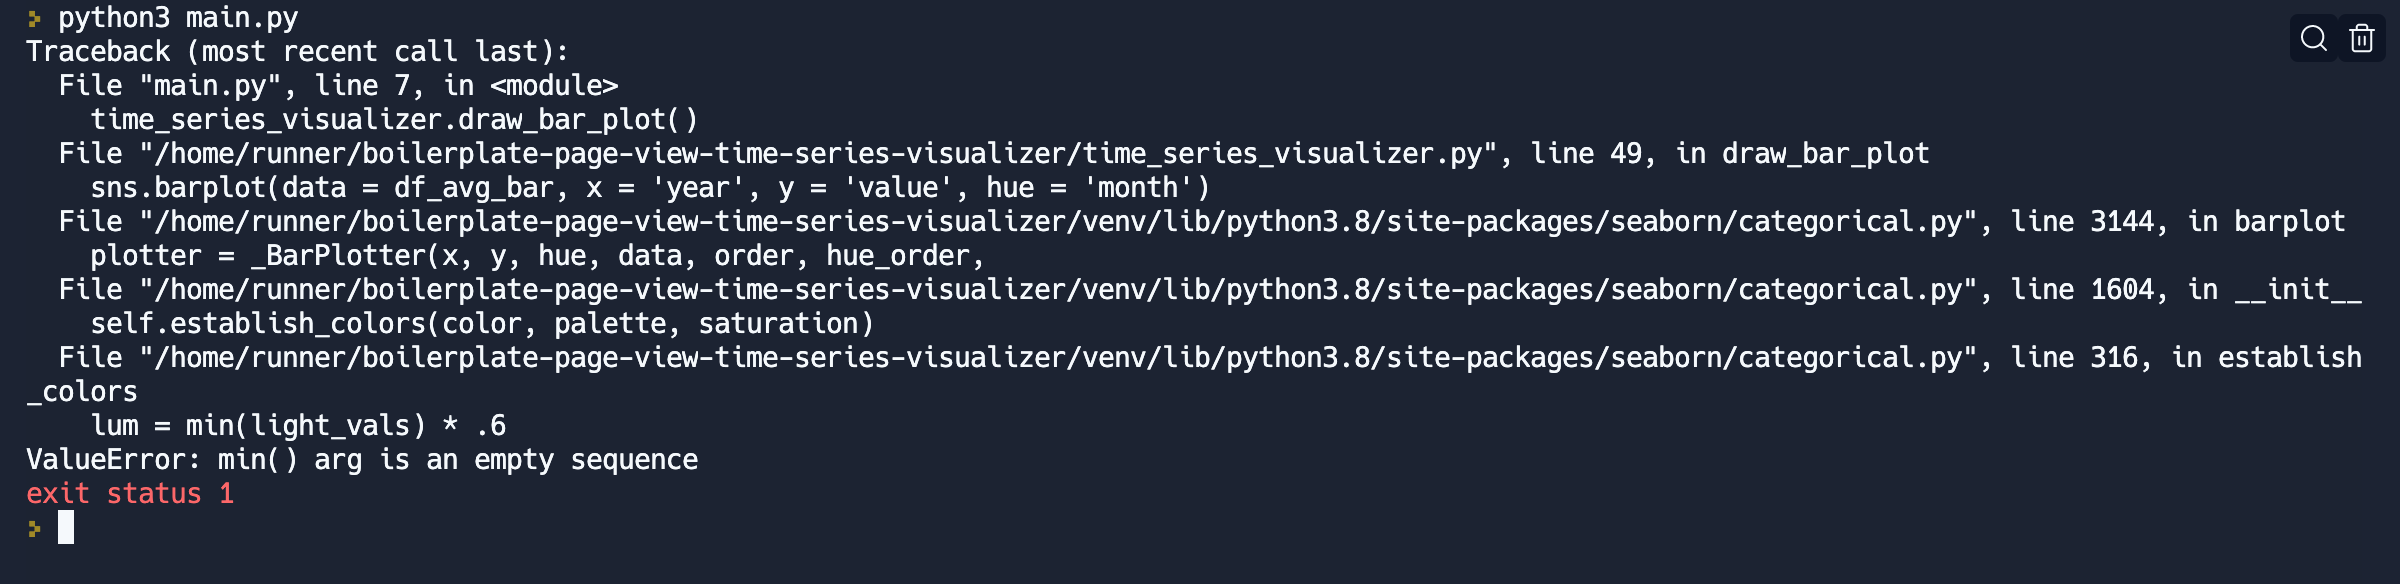
And then, in the following there is my code:
import matplotlib.pyplot as plt
import pandas as pd
import seaborn as sns
from pandas.plotting import register_matplotlib_converters
register_matplotlib_converters()

# Import data (Make sure to parse dates. Consider setting index column to 'date'.)
df = pd.read_csv('./fcc-forum-pageviews.csv')
# Parsing date
df['date'] = pd.to_datetime(df['date'])
# Column date set as index column
df = df.set_index('date')

# Clean data
# The page views were in the top 2.5% (all greater than 97.5 %) of the dataset
# The page views were in the bottom 2.5% (all smaller than 2.5%) of the dataset.
df = df.loc[(df['value'] <= df['value'].quantile(0.975)) &
           (df['value']) >= df['value'].quantile(0.025)
           ]

def draw_line_plot():
    # Draw line plot
    title_label = 'Daily freeCodeCamp Forum Page Views 5/2016-12/2019'

    fig, ax = plt.subplots(figsize=(15, 10))

    sns.lineplot(data = df, legend=False)
    ax.set_title(title_label)
    ax.set_xlabel('Date')
    ax.set_ylabel('Page Views')

    # Save image and return fig (don't change this part)
    fig.savefig('line_plot.png')
    return fig

def draw_bar_plot():
    # Copy and modify data for monthly bar plot
    df_bar = df.copy()
    df_bar.reset_index(inplace=True)

    df_bar['year'] = pd.DatetimeIndex(df_bar['date']).year
    df_bar['month'] = pd.DatetimeIndex(df_bar['date']).month_name()

    df_avg_bar = pd.DataFrame(df_bar.groupby(['year', 'month'])['value'].mean().round(decimals = 2))
    df_avg_bar.reset_index(inplace = True)

    # Draw bar plot
    fig, ax = plt.subplots(figsize=(10, 15))
    sns.barplot(data = df_avg_bar, x = 'year', y = 'value', hue = 'month')
    plt.xlabel('Years')
    plt.ylabel('Average Page Views')
    plt.legend(loc='upper left')
    # Save image and return fig (don't change this part)
    fig.savefig('bar_plot.png')
    return fig

def draw_box_plot():
    # Prepare data for box plots (this part is done!)
    df_box = df.copy()
    df_box.reset_index(inplace=True)
    df_box['year'] = [d.year for d in df_box.date]
    df_box['month'] = [d.strftime('%b') for d in df_box.date]

    # Draw box plots (using Seaborn)
    months = ['Jan', 'Feb', 'Mar', 'Apr', 'May', 'Jun',
              'Jul', 'Aug', 'Sep', 'Oct', 'Nov', 'Dec']

    fig, axes = plt.subplots(1, 2, figsize = (30, 10))

    #  Year-wise Box Plot (Trend)
    axes[0] = sns.boxplot(data = df_box, x = 'year', y = 'value', ax=axes[0])
    axes[0].set(ylim = (20000, 200000))
    axes[0].set_title('Year-wise Box Plot (Trend)')
    axes[0].set_xlabel('Year')
    axes[0].set_ylabel('Page Views')

    # Month-wise Box Plot (Seasonality)
    axes[1] = sns.boxplot(data = df_box, x = 'month', y = 'value', order = months, ax=axes[1])
    axes[1].set(ylim = (20000, 200000))
    axes[1].set_title('Month-wise Box Plot (Seasonality)')
    axes[1].set_xlabel('Month')
    axes[1].set_ylabel('Page Views')

    # Save image and return fig (don't change this part)
    fig.savefig('box_plot.png')
    return fig
I’m using Google Chrome, idk if it could be a problem. I hope someone will be able to help me, thank you a lot!
User Agent is: Mozilla/5.0 (Macintosh; Intel Mac OS X 10_15_7) AppleWebKit/537.36 (KHTML, like Gecko) Chrome/107.0.0.0 Safari/537.36
Challenge: Data Analysis with Python Projects - Page View Time Series Visualizer
Link to the challenge: