#this is my code
import matplotlib.pyplot as plt
import pandas as pd
import seaborn as sns
from pandas.plotting import register_matplotlib_converters
register_matplotlib_converters()
Import data (Make sure to parse dates. Consider setting index column to ‘date’.)
df = pd.read_csv(‘fcc-forum-pageviews.csv’,
index_col=“date”,
parse_dates=True)
Clean data
df = df[(df[‘value’]>=df[‘value’].quantile(0.025))&(df[‘value’]<=df[‘value’].quantile(0.975))]
def draw_line_plot():
# Draw line plot
fig, axes= plt.subplots(figsize=(18,7))
plt.plot(df,color=‘red’)
plt.title(“Daily freeCodeCamp Forum Page Views 5/2016-12/2019”)
plt.xlabel(‘Date’)
plt.ylabel(‘Page Views’)
# Save image and return fig (don't change this part)
fig.savefig('line_plot.png')
return fig
def draw_bar_plot():
# Copy and modify data for monthly bar plot
df.index = pd.to_datetime(df.index,format="%Y-%m-%d")
df_copy = pd.DataFrame(df)
df_copy[‘year’] = df_copy.index.year
df_copy[‘Month’] = df_copy.index.month
df_complete = df_copy.groupby([‘year’, ‘Month’])
df_complete=df_complete.mean()
df_complete=df_complete.unstack()
months=[‘January’,‘February’,‘March’,‘April’,‘May’,‘June’,‘July’,‘August’,‘September’,‘October’,‘November’,‘December’]
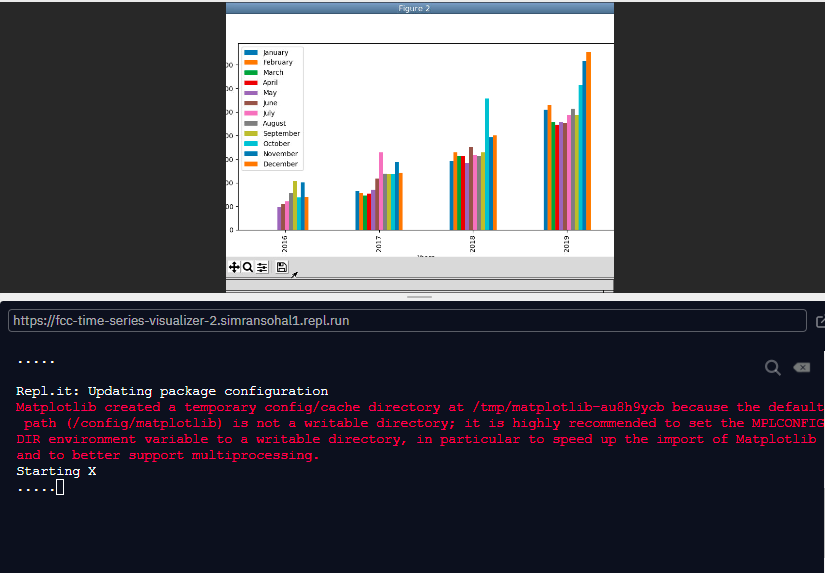
# Draw bar plot
fig=df_complete.plot(kind ="bar",  figsize = (10,5)).figure
plt.xlabel("Years")
plt.ylabel("Average Page Views")
plt.legend(fontsize = 10, labels = months)
plt.show()


# Save image and return fig (don't change this part)
fig.savefig('bar_plot.png')
return fig
def draw_box_plot():
# Prepare data for box plots (this part is done!)
df_box = df.copy()
df_box.reset_index(inplace=True)
df_box[‘year’] = [d.year for d in df_box.date]
df_box[‘month’] = [d.strftime(’%b’) for d in df_box.date]
df_box.sort_values(by=[‘year’,‘date’],ascending=[False,True],inplace=True)
# Draw box plots (using Seaborn)


fig, (ax_year1, ax_month1) = plt.subplots(1, 2)
fig.set_figwidth(15)
fig.set_figheight(7)


ax_year1 = sns.boxplot(x=df_box.year, y=df_box.value, ax=ax_year1)
ax_year1.set_xlabel('Year')
ax_year1.set_ylabel('Page Views')
ax_year1.set_title("Year-wise Box Plot (Trend)")

ax_month1 = sns.boxplot(x="month", y="value", data=df_box, ax=ax_month1)
ax_month1.set_xlabel('Month')
ax_month1.set_ylabel('Page Views')
ax_month1.set_title("Month-wise Box Plot (Seasonality)")


# Save image and return fig (don't change this part)
fig.savefig('box_plot.png')
return fig