Hi everyone,
I am trying to handle Medical Data Vis. Project, but I stacked at one point.
    # Create DataFrame for cat plot using `pd.melt` using just the values from 'cholesterol', 'gluc', 'smoke', 'alco', 'active', and 'overweight'.
    df_cat = df_cat = pd.melt(df, id_vars=["cardio"], value_vars=["cholesterol","gluc","smoke","alco","active","overweight"])


    # Group and reformat the data to split it by 'cardio'. Show the counts of each feature. You will have to rename one of the columns for the catplot to work correctly.
    df_cat = None
I guess I could do the first one my using pd.melt. However I couldn’t understand what it means by grouping and reformating data, What exactly expected and how can I do it.
I have this frame so far
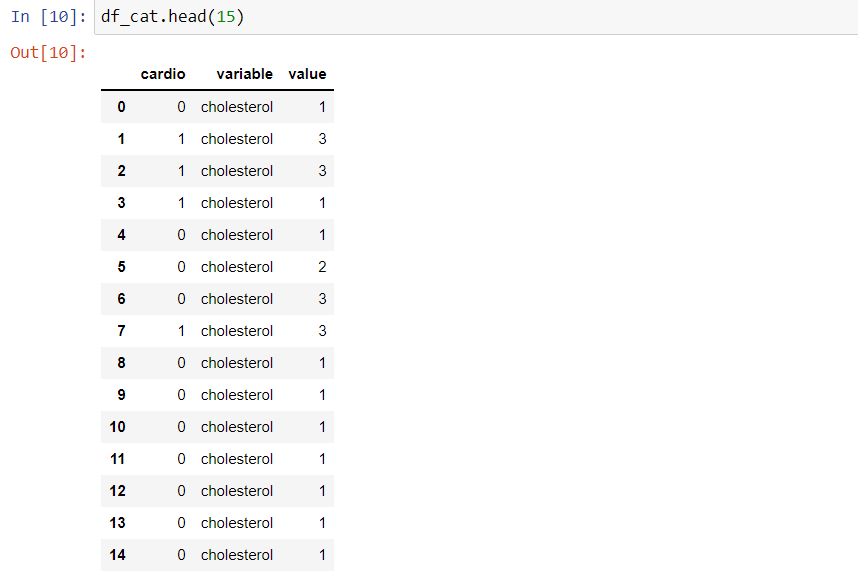
Should I just add another column for “cardio” but then how I will count values?
Thanks in advance for any help.