I ran my codes successfully on Jupyter Notebook with all the three plots correctly plotted except for the Box Plots where the y labels have value intervals different from the example plot in the file, hence the test failed.
The error below keeps popping up and I am left confused:
Matplotlib created a temporary config/cache directory at /tmp/matplotlib-q3lfbgir because the default path (/config/matplotlib) is not a writable directory; it is highly recommended to set the MPLCONFIGDIR environment variable to a writable directory, in particular to speed up the import of Matplotlib and to better support multiprocessing.
Find below my codes:
import matplotlib.pyplot as plt
import pandas as pd
import seaborn as sns
import numpy as np
from pandas.plotting import register_matplotlib_converters
register_matplotlib_converters()

# Import data (Make sure to parse dates. Consider setting index column to 'date'.)
df = pd.read_csv('fcc-forum-pageviews.csv')
df = df.set_index('date')
# Clean data
df = df[
    (df['value'] >= (df['value'].quantile(0.025))) &
    (df['value'] <= (df['value'].quantile(0.975)))
    ]
df.index = pd.to_datetime(df.index)


def draw_line_plot():

# Draw line plot
    fig = plt.figure(figsize=(6, 3))
    plt.plot(df.index, df['value'])
    plt.title('Daily freeCodeCamp Forum Page Views 5/2016-12/2019')
    plt.xlabel('Date')
    plt.ylabel('Page Views')


    # Save image and return fig (don't change this part)
    fig.savefig('line_plot.png')
    return fig

def draw_bar_plot():
    # Copy and modify data for monthly bar plot

    # Draw bar plot

    df_bar = df.copy()
    df_bar['year'] = df_bar.index.year
    df_bar['month'] = df_bar.index.month
    cbar = df_bar.groupby([df.index.year, df.index.month],)['value'].agg(np.mean).rename_axis(['year', 'month'])
    cbar = cbar.reset_index()

    df_pivtab = pd.pivot_table(cbar,
    values = 'value',
    index = 'year',
    columns = 'month')
    ax = df_pivtab.plot(kind='bar')
    fig = ax.get_figure()
    fig.set_size_inches(2,2)
    ax.set_xlabel('Years')
    ax.set_ylabel('Average Page Views')
    plt.legend(['January', 'February', 'March', 'April', 'May', 'June', 'July', 'August', 'September', 'October', 'November', 'December'], title = 'Months')

    # Save image and return fig (don't change this part)
    fig.savefig('bar_plot.png')
    return fig

def draw_box_plot():
    # Prepare data for box plots (this part is done!)
    df_box = df.copy()
    df_box.reset_index(inplace=True)
    df_box['year'] = [d.year for d in df_box.date]
    df_box['month'] = [d.strftime('%b') for d in df_box.date]

    # Draw box plots (using Seaborn)
    df_box = df.copy()
    df_box.reset_index(inplace=True)
    df_box['year'] = [d.year for d in df_box.date]
    df_box['month'] = [d.strftime('%b') for d in df_box.date]

    fig,axis = plt.subplots(1,2)
    fig.set_size_inches(4,2)
    sns.boxplot(x = df_box['year'], y = df_box['value'], ax = axis[0]).set(xlabel='Year', ylabel='Page Views')
    sns.boxplot(x = df_box['month'], y = df_box['value'],
        order=['Jan', 'Feb', 'Mar', 'Apr', 'May', 'Jun', 'Jul', 'Aug', 'Sep', 'Oct','Nov', 'Dec'],
        ax = axis[1]).set(xlabel='Month', ylabel='Page Views')
    axis[0].set_title('Year-wise Box Plot (Trend)')
    axis[1].set_title('Month-wise Box Plot (Seasonality)')


    # Save image and return fig (don't change this part)
    fig.savefig('box_plot.png')
    return fig
I’ve edited your post for readability. When you enter a code block into a forum post, please precede it with a separate line of three backticks and follow it with a separate line of three backticks to make it easier to read.
You can also use the “preformatted text” tool in the editor (</>) to add backticks around text.
See this post to find the backtick on your keyboard.Note: Backticks (`) are not single quotes (’).
sanity
March 26, 2021, 9:14am
4
That’s not an error, and it’s unrelated to the failing test.
Test failing is caused by setting plot size too small, what limits numbers of labels displayed.
I have used different fig sizes , the error persists. I had to reduce the plot sizes with the hope that the codes would run successfully.
On the failed test, below is what I got:
FAIL: test_box_plot_labels (test_module.BoxPlotTestCase)
Traceback (most recent call last):
First differing element 1:
Second list contains 6 additional elements.
[‘0’, ‘50000’, ‘100000’, ‘150000’, ‘200000’]
[‘0’,
‘20000’,
‘40000’,
‘60000’,
‘80000’,
‘100000’,
‘120000’,
‘140000’,
‘160000’,
‘180000’,
‘200000’] : Expected box plot 1 secondary labels to be ‘0’, ‘20000’, ‘40000’, ‘60000’, ‘80000’, ‘100000’, ‘120000’, ‘140000’, ‘160000’, ‘180000’, ‘200000’
Ran 11 tests in 5.808s
FAILED (failures=1)
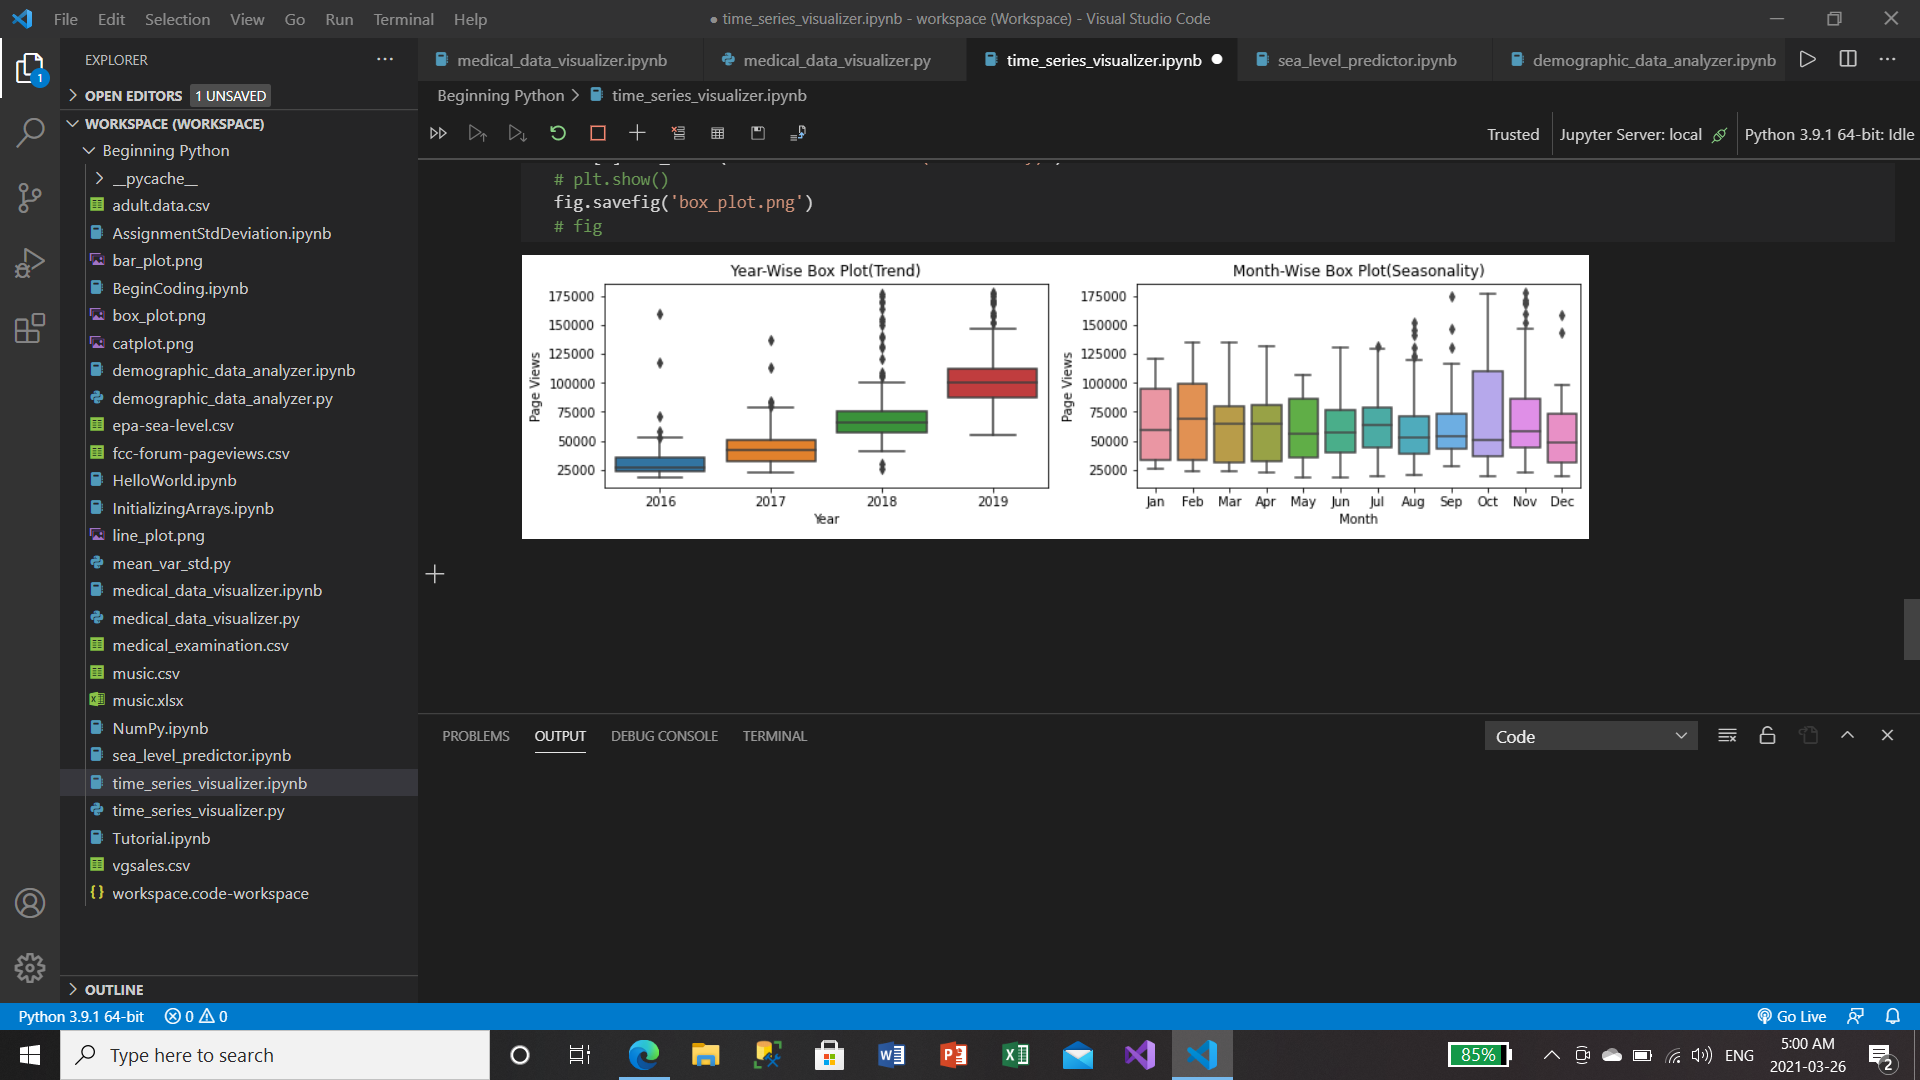
My box plot on Jupyter notebook below:
Thank you for the editing @jwilkins.oboe
sanity
March 26, 2021, 10:04am
7
I’ve removed it completely and on repl.it test passed without error.
system
September 24, 2021, 10:05pm
8
This topic was automatically closed 182 days after the last reply. New replies are no longer allowed.