I keep failing the last test in budget app, I’m not sure why, I think it might be white spaces but I don’t really understand the test file, when I plug in the requirements to my own notebook the program runs just fine.
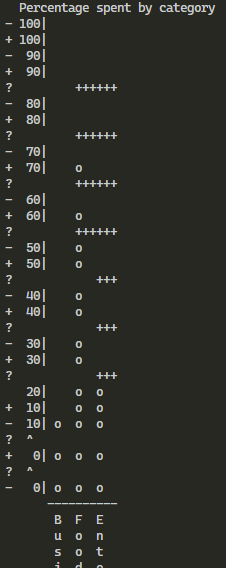
On the left side is your output and or the right is the expected/correct
At first you can notice that there is a difference in white spaces between the numbers (100 90 80 etc.). The chart must have 10 white spaces between each number when you don’t use the “o” marker.
Here you can compare your chart-output to the expected chart-output.
The “-” is your chart and the “+” is the expected. As mentioned above you can see that between 90 and 80 there is a “?” and “++++++” which means that you have to add 6 more white spaces (\n 90|<10 white spaces>\n 80 etc.).
But there has to be a calculation or (again) chart formation mistake. Notice that on the 70% and 60% you don’t add the “o” marker even though in the correct form there is one.
I tried to fix you code but it’s too complicated for me … sorry. The only thing that I could do is to fix the spaces between the 100% 90% and 80% but again the rest of the chart kind of messes up every time I touch something. I believe that you can figure it out though because you know your code better
I have since made some edits to my code to make it more compact and readable, in turn fixing the spacing problem. But I don’t understand why during the test my code is not putting o’s in certain places. When I run it in jupyter with the test code (I included what I test it with at the bottom) I get a perfect graph, with o’s at 50,60,70 for food, and 20 for entertainment. But in the replit test it fails.