Can someone tell me why I currently can;t see the bar chart? Thank you!
You have a typo in your function
createStuff(data);

function creatStuff(data) { ... }
This is the error that you’re getting but it’s not shown in codepen console unfortunately.
pen.js:44 Uncaught (in promise) ReferenceError: createStuff is not defined
at pen.js:44
When working in codepen I recommend using devtools for debugging ![]()
Thanks! I forgot I could use VSCode for help, lol. It’s been a while since I’ve done any serious projects. 
 but instead of their console I do something like this
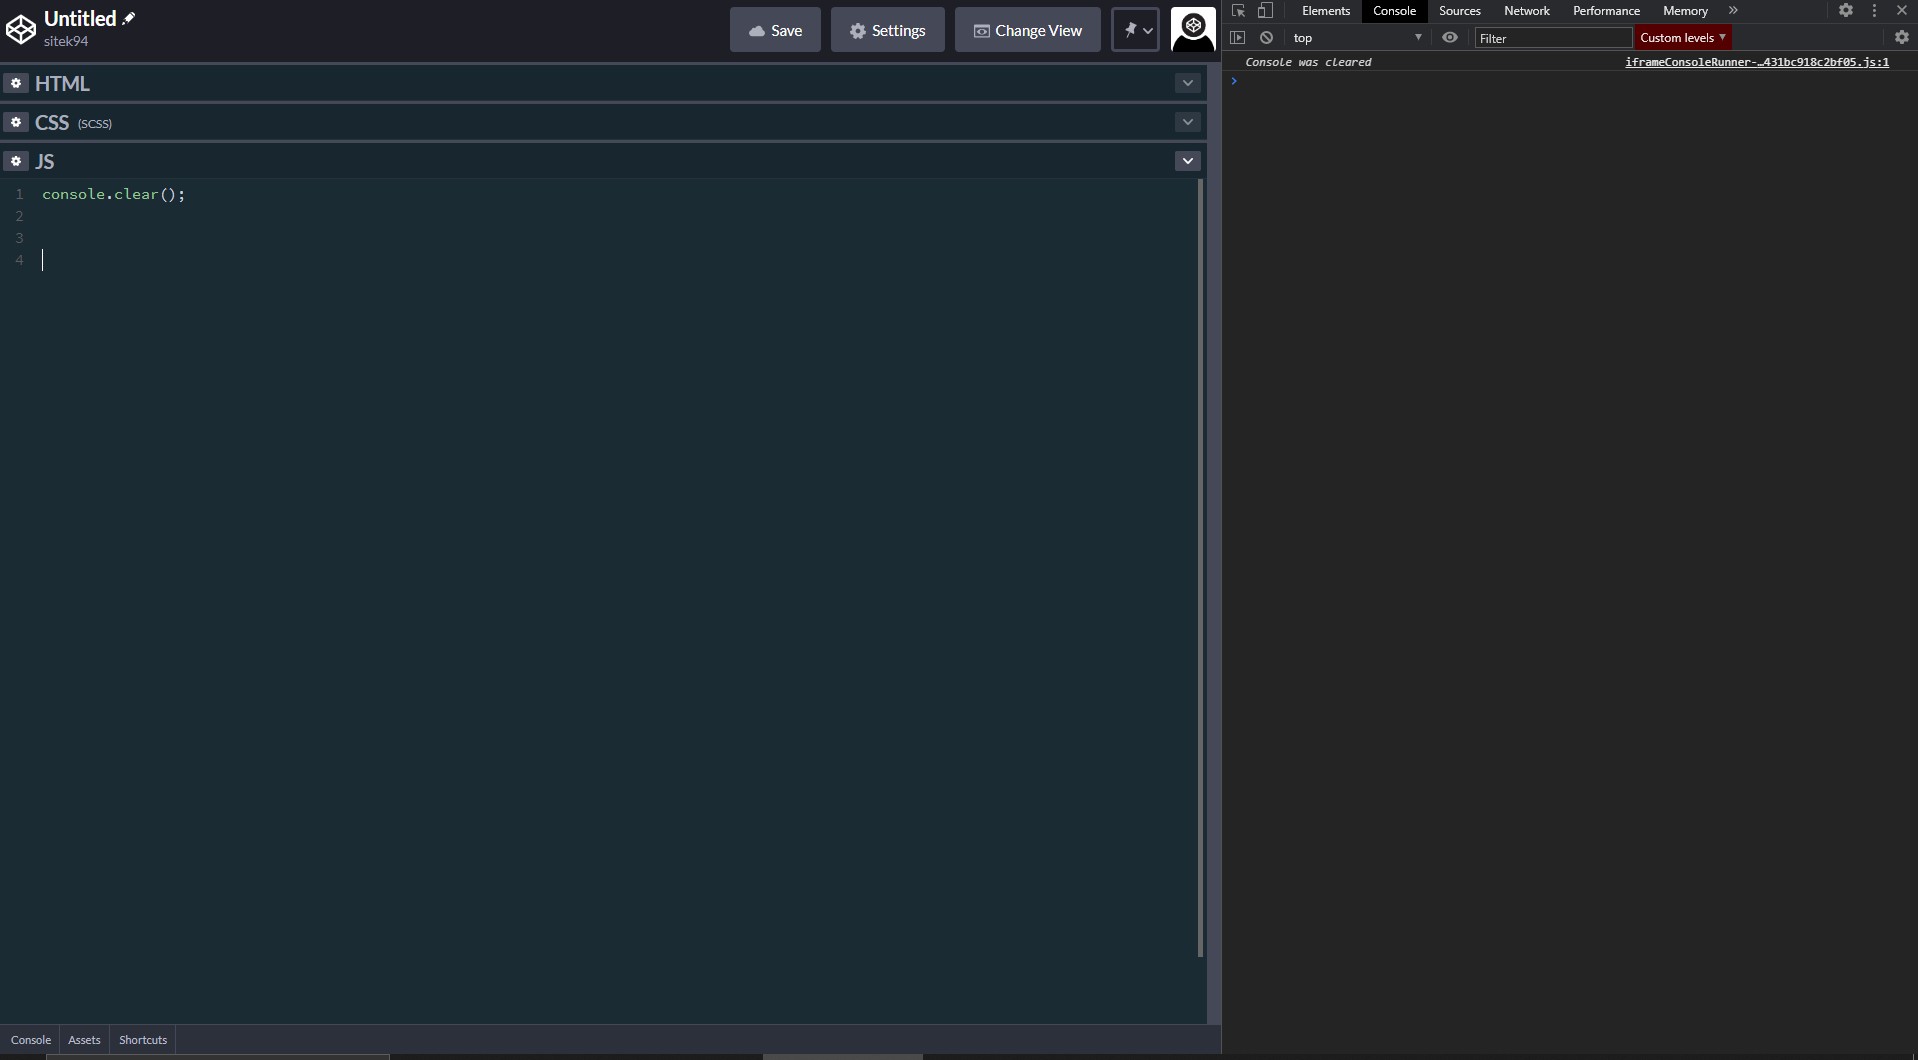
I should be able to see my yaxis now. Why can’t I?


Oops. Hee hee. Thanks.
I’m almost done. But this is not passing one of the tests. I don’t know why because i can’t understand. Can I have a little help? Thank you! 
This is the error message.
Tooltip’s “data-date” property should be equal to the active area’s “data-date” property: expected ‘undefined’ to equal ‘1970-07-01’
It says that property data-date is undefined. My idea would be to check where are you setting this property.
This is where you set attribute data-date in your tooltip. I’d recommend console logging and checking what actually d is, because it might not be what you expect it to be ![]()
.on("mouseover", (d, i) => {
  console.log(d);
  tooltip.setAttribute("data-date", d[0]);
})
PS I’d recommend creating new topic next time if you have another issue, because this one is already marked as a one with solution so people won’t know that you still need some help ![]()