Build a Budget App Project - Build a Budget App Project - create_spend_chart

Tell us what’s happening:

I am struggling to get my spend_chart to pass.

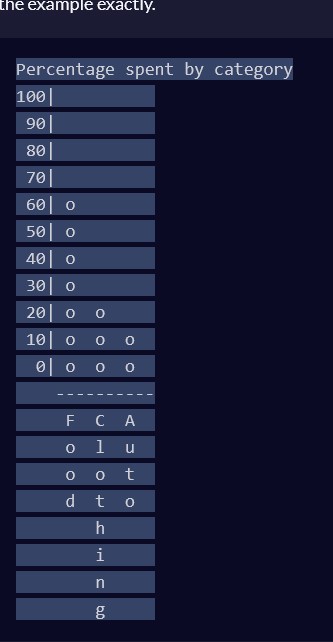
18: “create_spend_chart” should have correct percentages down the left side"
I think I have the graph section correct? with a leading " " to account for alignment between “100|” and " 90|" (two for " 0|") do I need to mess around with .format() and right-alignment instead?

19: “the height of each bar should be rounded down to the nearest 10”
I think I’ve done that too?

20: “each line in create_spend_chart should be the same length”
unsure why this is failing

EDIT: I’ve been looking in the log (F12) and I cannot for the life of me understand why the chart is printing incorrectly, it also seems to be striping the “|” from the hard coded items in the lines - very stuck :frowning:

Your code so far

class Category:
    def __init__(self, description):
        self.description = description.capitalize()
        self.ledger = []
        self.amount = 0

    def deposit(self, amount, description = ""):
        self.ledger.append({"amount": amount, "description": description})
        self.amount += amount
    
    def withdraw(self, amount, description = ""):
        if self.check_funds(amount):
            self.ledger.append({"amount": (float(amount) * -1), "description": description})
            self.amount -= amount
            return True
        return False

    def get_balance(self):
        return self.amount

    def transfer(self, amount, other_Category):
        if self.check_funds(amount):
            self.withdraw(amount, f'Transfer to {other_Category.description}')
            other_Category.deposit(amount, f'Transfer from {self.description}')
            return True
        return False

    def check_funds(self, amount):
        return amount <= self.amount

    def __str__(self):
        title_stars = int((30 - len(self.description)) / 2)
        if len(self.description) % 2 == 0:
            title_line = ("*" * title_stars) + self.description + ("*" * title_stars)
        else:
            title_line = ("*" * title_stars) + self.description + ("*" * title_stars) + "*"
        entries = ""
        amount_total = 0
        for item in self.ledger:
            entry = "{:<23}{:>7.2f}".format(item['description'][:23], item['amount'])
            entries += entry + "\n"
            amount_total += item['amount']
        category_total = f'Total: {amount_total}'
        return title_line + "\n" + entries + category_total
         
def create_spend_chart(categories):
    title = "Percentage spent by category\n"
    lines = {
        100: "100|",
        90: " 90|", 
        80: " 80|", 
        70: " 70|", 
        60: " 60|", 
        50: " 50|", 
        40: " 40|", 
        30: " 30|", 
        20: " 20|", 
        10: " 10|", 
        0: "  0|"
        }
    bar = "    -"
    total_spent = 0
    cats = {}

    for category in categories:
        bar += "---"
        for item in category.ledger:
            if item["amount"] < 0:
                total_spent += abs(item["amount"])
        
    for category in categories:
        spent = 0
        for item in category.ledger:
            if item["amount"] < 0:
                spent += abs(item["amount"])
        percent = ((spent / total_spent) * 10) // 10
        cats[category.description] = percent
    
    for percent in cats.values():
        for line_key in lines.keys():
            if percent >= line_key:
                lines[line_key] += " o "
            else:
                lines[line_key] += "   "
   
    max_length = max(len(category.description) for category in categories)
    category_names = ["    " for _ in range(max_length)]

    for category in categories:
        position = 0
        while position < max_length:
            if position < len(category.description):
                category_names[position] += f" {category.description[position]} "
            else:
                category_names[position] += "   "
            position += 1

    lines_string = ""
    for line in lines:
        lines_string += f"{line} \n"
    
    bar += "\n"

    category_names_string = ""
    for line in category_names:
        category_names_string += f"{line} \n"

    category_names_string = category_names_string.strip("\n")
 
    return title + lines_string + bar + category_names_string

Your browser information:

User Agent is: Mozilla/5.0 (Windows NT 10.0; Win64; x64) AppleWebKit/537.36 (KHTML, like Gecko) Chrome/131.0.0.0 Safari/537.36

Challenge Information:

Build a Budget App Project - Build a Budget App Project

Did you check the devtools console output? f12

Please share that output.

I have been! check my edit in the post

you are not filling the chart

if you look at the browser console as suggested you could see

AssertionError: 'Perc[24 chars]\n100 \n90 \n80 \n70 \n60 \n50 \n40 \n30 \n20 [229 chars] t  ' != 'Perc[24 chars]\n100|          \n 90|          \n 80|        [350 chars] t  '

which means that your chart lines end right after the numbers on the left side

AssertionError: 'Perc[24 chars]\n100 \n90 \n80 \n70 \n60 \n50 \n40 \n30 \n20 [229 chars] t ' != 'Perc[24 chars]\n100| \n 90| \n 80| [350 chars] t '

If you highlight the chart with the mouse, you can see there are spaces at the end of each line to make them all the same length

I see that, but I don’t understand why that is. Is the character a special character requiring a \ or something similar?

if you see how I’ve initialized this list, even if this block isn’t functioning, there should still be preceding whitespace and a | following the percentage?

 for percent in cats.values():
        for line_key in lines.keys():
            if percent >= line_key:
                lines[line_key] += " o "
            else:
                lines[line_key] += "   "

Which part of code is responsible of adding |? How could you confirm they are really there?

I’ve edited this post so you can see the spacing. If you post it as regular text all the extra spaces are removed. Format it as code.

When you enter a code block into a forum post, please precede it with a separate line of three backticks and follow it with a separate line of three backticks to make it easier to read.

You can also use the “preformatted text” tool in the editor (</>) to add backticks around text.

See this post to find the backtick on your keyboard.
Note: Backticks (`) are not single quotes (').

What happens with lines after that?

lines_string = ""
    for line in lines:
        lines_string += f"{line} \n"

Print out each step just so you can see it and what’s happening. Confirm the output at each step if you need to.

It sounds like you know why it’s not passing now? You just need to troubleshoot and find out where it’s breaking.

i think I knew before - but thank you so much for your help!

Oddly, I’m also having issues printing it in the console - perhaps that’s actually where the problem is! I will get back to you after a (hopefully) successful debugging session.

That makes two places where something unexpected happens. As mentioned in another answer, you could try to add printing to console, to try pinpointing the issue.

Different option could be copying or writing again the relevant parts, outside of the function, creating simplified examples to make sure the idea works as intended. Here for that, other than the two code snippets, would be required also some example lines and cats dictionaries.

Thanks for your help. Busy few days but I’ve just successfully debugged this.

The main error was here:

lines_string = ""
    for line in lines:
        lines_string += f"{line} \n"

with another small one in the floor calculation of percent.

Thanks for all of your help!

This topic was automatically closed 182 days after the last reply. New replies are no longer allowed.